Student Outcomes - Baccalaureate Level Program
Enrollment & Graduation Data
HSDA Majors and Minors
The following table presents data on the number of HSDA majors and minors between fall 2017 and fall 2022.

- Fall 2018: 104 Majors, 37 Minors
- Fall 2019: 94 Majors, 40 Minors
- Fall 2020: 69 Majors, 37 Minors
- Fall 2021: 67 Majors, 43 Minors
- Fall 2022: 58 Majors, 47 Minors
HSDA Graduates
The following table presents aggregate data on the number of HSDA degrees conferred in from 2018-2022 with average GPA per calendar year.

- 2018: 25
- 2019: 44
- 2020: 41
- 2021: 32
- 2022: 26
| Term | Avg. Enrolled Hours | Avg. Age | Pell Grant | First Generation | Avg. GPA |
|---|---|---|---|---|---|
|
Fall 2018 |
12.94 | 28.4 | 66 | 42 | 3.13 |
|
Fall 2019 |
12.33 | 26.1 | 45 | 31 | 3.13 |
|
Fall 2020 |
12.59 | 25.4 | 37 | 23 | 2.97 |
|
Fall 2021 |
12.13 | 24.3 | 35 | 22 | 3.04 |
|
Fall 2022 |
11.65 | 23.4 | 30 | 17 | 3.01 |
| Fall 2018 | Fall 2019 | Fall 2020 | Fall 2021 | Fall 2022 | ||||||
|---|---|---|---|---|---|---|---|---|---|---|
|
Asian or Pacific Islander |
4 | 4% | 5 | 5% | 2 | 3% | 5 | 7% | 0 | |
|
Black |
1 | 1% | 10 | 11% | 7 | 10% | 6 | 9% | 8 | 14% |
|
Black or African American |
11 | 11% | 0 | |||||||
|
Hispanic |
21 | 21% | 28 | 31% | 17 | 25% | 13 | 19% | 20 | 34% |
|
Multiracial |
2 | 2% | 2 | 2% | 3 | 4% | 1 | 2% | 1 | >1% |
|
Native Hawaiian or Pacific Islander |
1 | 2% | 1 | 2% | ||||||
|
Unknown |
1 | 2% | ||||||||
|
White |
60 | 61% | 44 | 49% | 38 | 56% | 41 | 61%29 | 29 | 48% |
|
Total |
99 | 90 | 68 | 67 | 58 |
Human Services - Board Certified Practitioner (HS-BCP) Exam Data
HS-BCP Pass Rate
The following table presents aggregate HS-BCP pass rate data by academic year.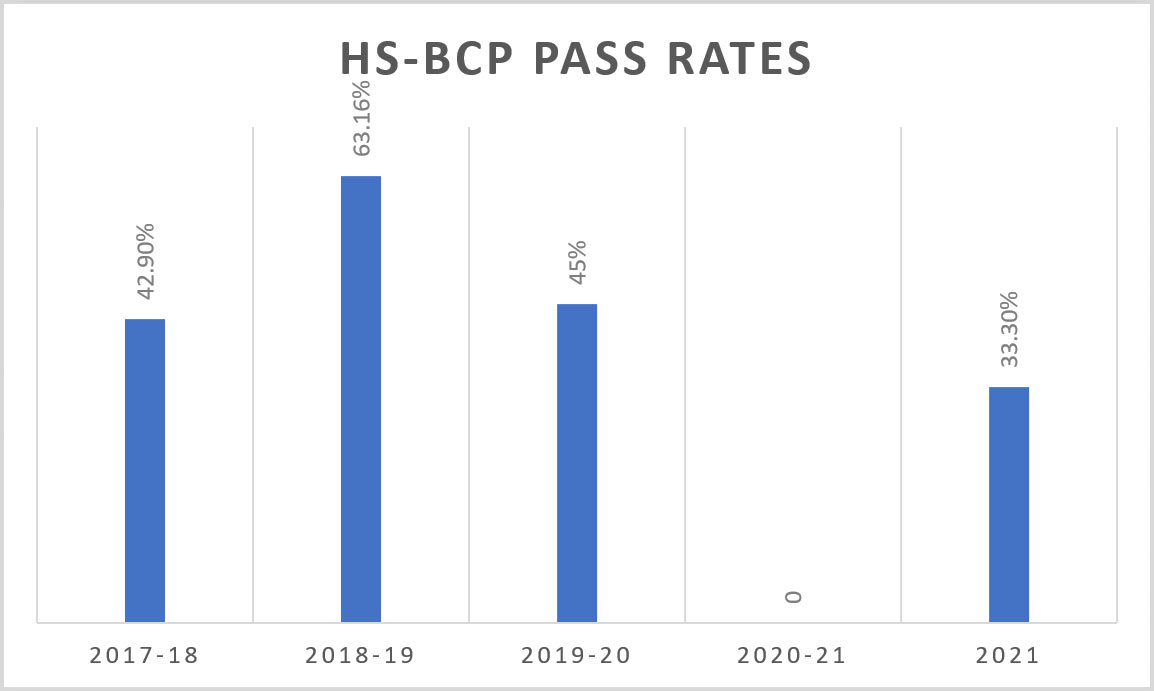
- 2017-2018: 42.9%
- 2018-2019: 63.16%
- 2019-2020: 45%
- 2020: n/a - Testing center closed
- 2021: 33.3%
HS-BCP Results by Content Area
The following table presents data on student performance on the HS-BCP by content area (2020-21 data has not been provided by the Center for Credentialing and Education):
| Content Area | 2017-2018 Mean (n=7) |
2018-2019 Mean (n=19) |
2019-2020 Mean (n=20) |
|---|---|---|---|
| Assessment, Service Planning and Outcome | 17.08 | 18.61 | 17.11 |
| Theoretical Orientations/Interventions | 13.16 | 22.89 | 14.33 |
| Case Management, Professional Practice and Ethics | 24.34 | 22.5 | 22.0 |
| Administration, Program Development, Evaluation and Supervision | 9.7 | 9.81 | 8.67 |
Comparative Overall Means
The following table compares the overall means for UNG students to other CSHSE programs, Non-Accredited Programs, and Others (usually professionals). 2020-21 data has not been provided by the Center for Credentialing and Education.
| 2017-18 | 2018-19 | 2019-20 | |
|---|---|---|---|
| UNG | 64 | 66.62 | 62.11 |
| CSHSE Accredited Programs | 57.32 | 63.36 | 63.56 |
| Non-Accredited Programs | 59.5 | 62.23 | 59.00 |
| Others (usually professionals) | 65.05 | 66.15 | 66.15 |
Job Placement
Employers
- Gainesville Housing
- Hall County DFCS
- Legacy Link
- Supporting Adoption and Foster Families Together (SAFTT)
- Hall County Schools
- Gateway Domestic Violence Center
- Jackson County High School
- The Summit Wellness Group
- A Better Way Recovery
- Mt. Judicial Circuit Accountability Courts
- Goodwill
- Morgan Stanley
- City of Gainesville
Types of Positions
- Executive Director
- Community Manager
- Employment Assistant Coordinator
- Case Manager
- Design Assistant
- College Access Coach
- Administrative Assistant
- Alternative Sentencing Specialist
- Child Advocate
- School Counselor
- Community Outreach Director
- Aging & Disability Resource Counselor
- Housing Specialist
- Child Protective Services Investigator
Community Partner Feedback
In fall 2020 the HSDA program surveyed community partners in order to gain feedback on the field practicum curriculum and students. Key results related to student performance are presented in the below table.
Feedback on Students
Community partners who had hosted an HSDA students within the past five years were asked to assess student performance. Results are indicated in the table below:
| Statements | Strongly Agree/Agree | Somewhat Agree | Neither Agree or Disagree | Somewhat Disagree | Strongly Disagree/Disagree |
|---|---|---|---|---|---|
| I would hire an HSDA student. | 87.5% | 6.25% | 0 | 0 | 0 |
| HSDA students are professional. | 90.63% | 3.13% | 6.25% | 0 | 0 |
| HSDA students are prepared to work in human services settings. | 90.63% | 0 | 6.25% | 3.13% | 0 |
Student Alumni Feedback
In fall 2022 an alumni survey was conducted for the Department of Sociology and Human Services. The survey was sent to roughly 500 alumni who graduated between 2013 and 2022. The following data represents HSDA alumni graduating between 2017-2022. The HSDA program has conferred 184 degrees during that time and 36 surveys were completed for a 28% response rate.
Employment – Highlights:
- 91.67% are employed full-time
- 36.1% had a job at graduation, 69% had a job within five months, and 86% had a job within a year of graduating
- Students are also finding jobs in a wide variety of settings, with the majority working in non-profit (38.9%) and public/government (33.3%) settings
| Employment Sector | Percentage |
|---|---|
| Self-employed in own business or professional non-group practice | 5.6% |
| For-profit corporation/group-practice | 16.7% |
| Government or other public institution or agency, including military | 33.3% |
| Non-profit organization, institution or NGO | 38.9% |
| Other | 5.6% |